About
Building a circular economy
for future generations
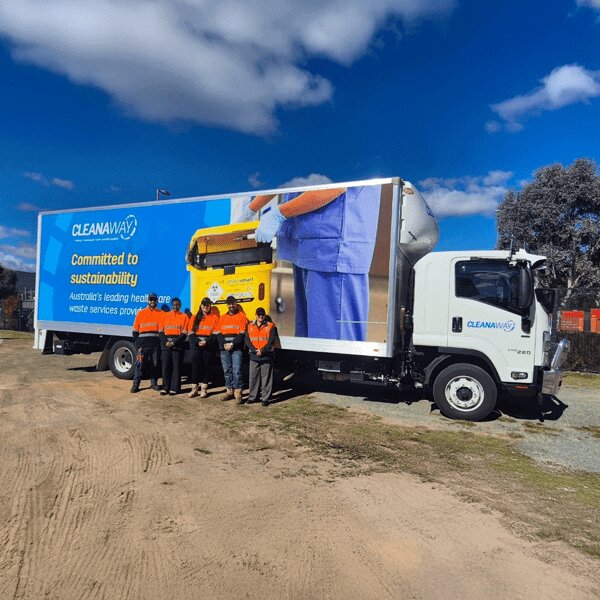
Cleanaway is Australia’s leading waste management and resource recovery company, helping businesses, councils and communities turn waste into valuable resources.
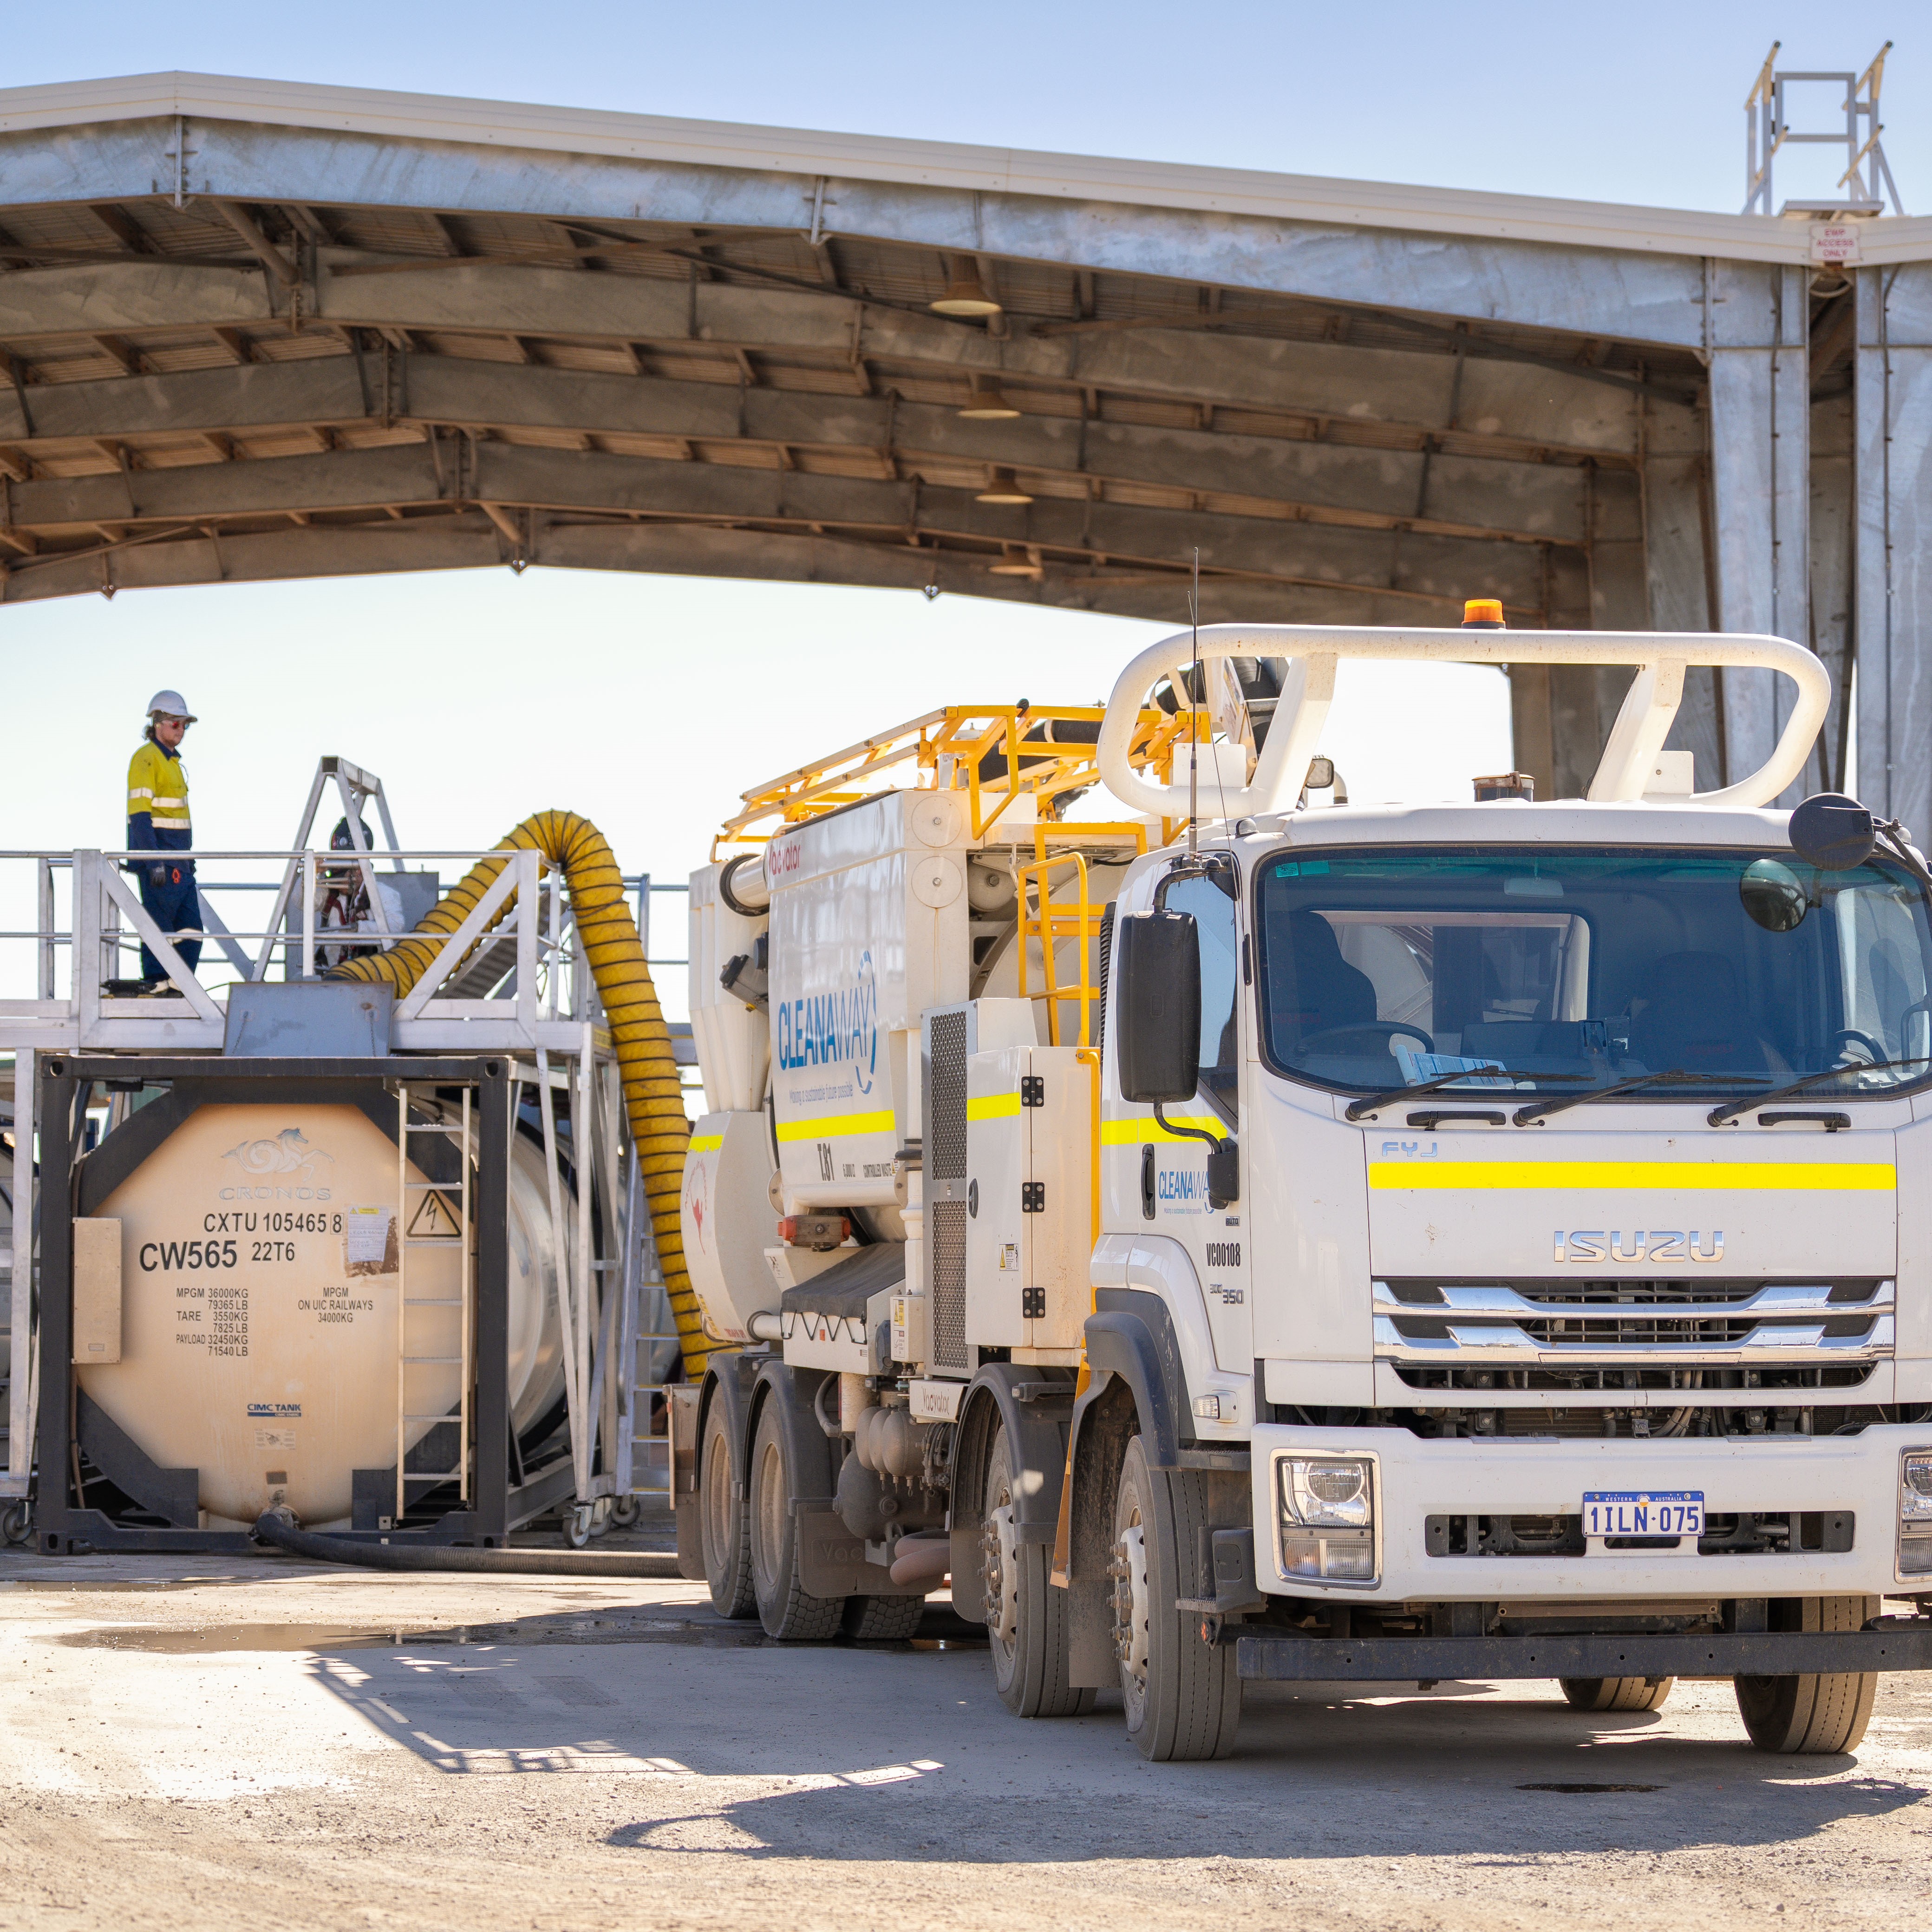
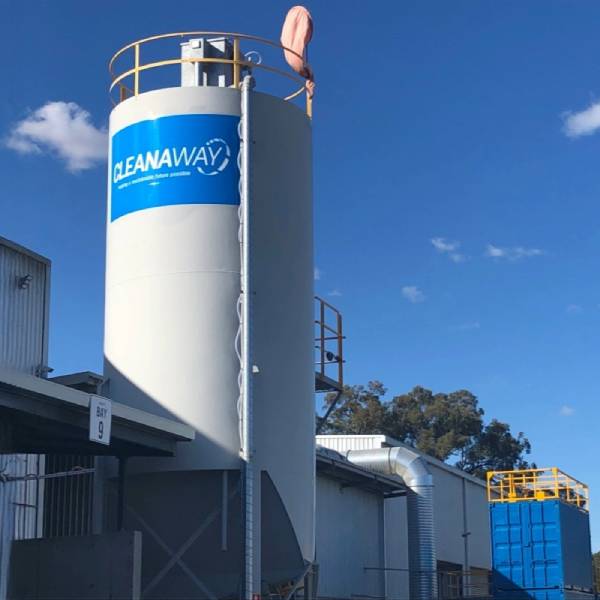
With the nation’s largest network of collection, recycling, treatment and disposal facilities, we deliver reliable, safe and sustainable solutions for a wide range of waste streams. We continually invest in innovation and new technologies, always looking for better ways to recover more materials, reduce landfill, and unlock value from waste that would otherwise be lost.
For more than 70 years, we’ve partnered with customers across all industries to reduce environmental impact and work towards the creation a circular economy. From everyday collections to complex industrial projects, our goal is simple: to make a sustainable future possible together with Australia by keeping materials in use and minimising waste to landfill.
Our purpose
Turning waste into resource
Our purpose is to make a sustainable future possible together by helping customers recover more resources and reduce their environmental impact. Every service we deliver supports Australia’s transition to a circular economy.
Commitment
Sustainabilityat our core
Sustainability is at the heart of everything we do. From investing in advanced recycling technologies to helping customers achieve their environmental targets, we are committed to reducing waste, recovering more resources and building a circular economy. Our strategy is guided by clear goals in climate action, resource recovery, safety and community outcomes.
![]()
Impact
National expertise, local service Australia’s largest waste management network
![]()
Updates
Shaping a sustainable future together Stories of innovation and impact
![]()
Collaboration
Let's work together
We work with customers across the country, from SMEs and municipal councils to national organisations, to service their waste management and recycling needs with tailored and dedicated solutions.

Small and Medium Enterprises
We provide flexible, reliable waste and recycling services tailored to the needs of SMEs. From simple collections to resource recovery solutions, we help you manage costs, meet compliance requirements and demonstrate your commitment to sustainability.
Large businesses and industry
We partner with organisations of every scale to deliver safe, compliant and cost-effective waste management. With Australia’s largest network, we design solutions that improve efficiency, support sustainability targets and keep complex operations running smoothly.
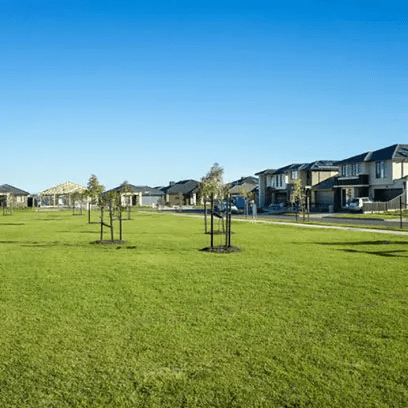
Municipal and local councils
We work with councils to provide reliable waste and recycling services for communities. From kerbside collections to resource recovery initiatives, we help improve diversion from landfill, support sustainability targets and create cleaner, healthier neighbourhoods.