
About
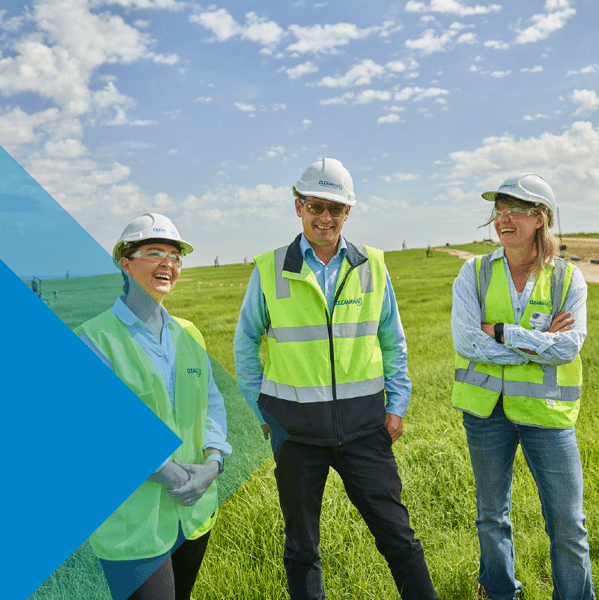
Committed to a sustainable future
Our Sustainability Reports outline the progress we are making against our four sustainability pillars and our role in supporting Australia’s transition to a circular economy. Each report details our performance, key initiatives, and measurable outcomes, providing transparent insight into how we manage environmental, social, and governance responsibilities. Explore our latest results alongside past reports to see how we are tracking on our commitments and where we are focusing our efforts next.
Our commitment
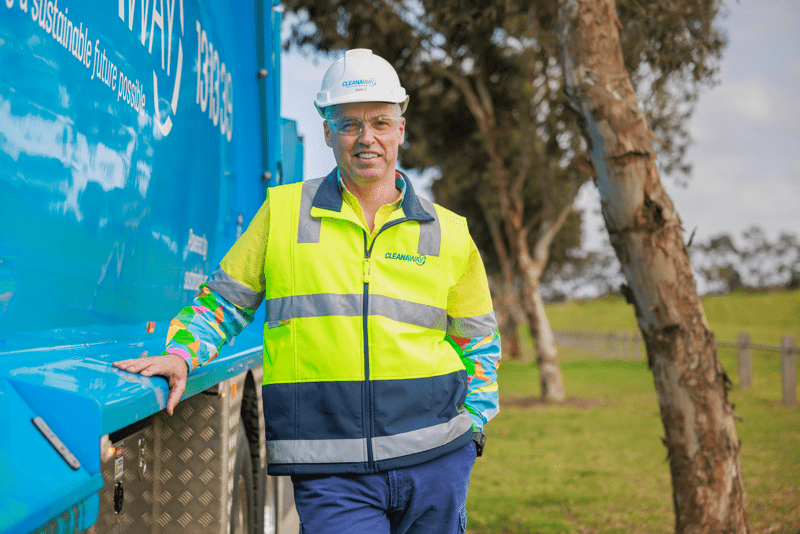
Message from our CEO
“Making a sustainable future possible together means keeping people safe, reducing emissions, protecting the environment, and using resources wisely. FY25 tested us with challenges, but also marked important progress. We advanced our safety and respect culture, reduced gross Methane and Carbon Dioxide emissions against our FY22 baseline, and expanded capacity to recover more resources across Australia. We remain focused on turning lessons into action and delivering sustainable outcomes for our customers and communities.”
Mark Schubert, CEO and Managing Director
Our promise
Our sustainability pillars
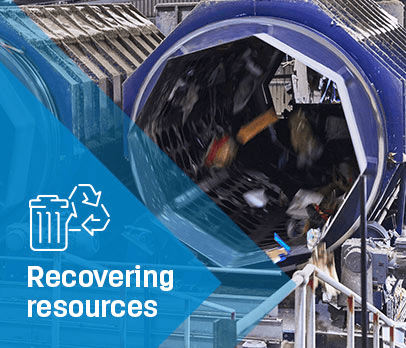
Recovering resources
We play a vital role in enabling Australia’s circular economy, working with our partners to ensure valuable resources are recovered from waste streams and returned to the value chain.
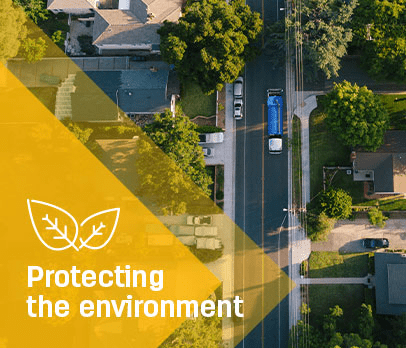
Protecting the environment
As a total waste solutions provider, we prioritise resource reuse, recycling, and recovery wherever possible. When these options are not feasible, we offer safe and responsible, at-scale treatment and disposal solutions.
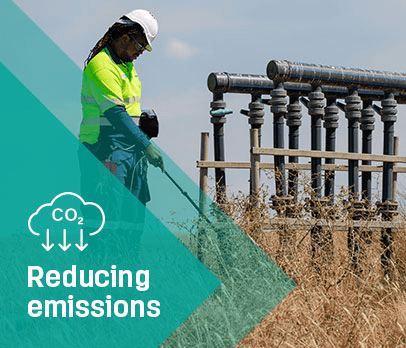
Reducing emissions
The goal of net zero compels us all to take action to reduce the impacts of climate change. Cleanaway is committed to reducing our emissions and helping our customers do the same.
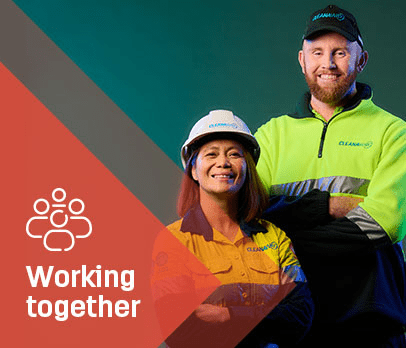
Working together
To deliver on our mission requires the co-ordinated effort and hard work of our people, suppliers and communities. Together, we fulfil our purpose of making a sustainable future possible together.
Recovering resources
By recovering resources that would otherwise go to waste, we are replacing virgin materials with recycled alternatives, reducing emissions and supporting local manufacturing.
We recovered the equivalent of 8% of Australia's total recycled plastic processed onshore, supporting local circular economy outcomes *.
We produced 29ML of re-refined base oil through our facilities, replacing virgin base oil in new lubricant formulation.
We recovered the equivalent of 21% of Australia's post-consumer paper and paperboard packaging placed on market, contributing to national circularity targets.
We produced 14ML of used cooking oil that can be used as feedstock to produce low-carbon fuels such as sustainable aviation fuel and renewable diesel.

Protecting the environment
An increased focus and investment on environmental compliance across our network has supported a 69% reduction in regulatory enforcement notices since FY21
Cleanaway has invested more than $25 million in fire infrastructure and associated risk reduction initiatives to reduce fire incident severity and strengthen operational resilience over the past two years.
There has been a 62% reduction in medium-sized fires in FY25 vs FY24.
Spent more than $35 million undertaking extensive programs of works to manage leachate and landfill gas on-site to minimise the potential for off-site impacts.
Reducing emissions
Cleanaway is taking practical steps to decarbonise our operations and support Australia’s transition to a low-carbon circular economy.
Gross Methane emissions declined by 17% against FY22 baseline
Gross Carbon Dioxide emissions declined by 3% against FY22 baseline
Net combined GFG emissions declined by 13% against FY22 baseline

Working together
Total Recordable Injury Frequency Rate (TRIFR) 1
FY24 4.6
↑ 1.7% from prior year
FY24 24.3%
sessions held nationally 2
FY24 1,555
people engaged
FY24 32,500+
- TRIFR calculation includes employees, non-permanent labour, contractors, large contractors, owner drivers and hours associated with employee leave. For more information please visit ESG data book.
- A session is defined as a warkshop or any similar type of gathering regardless of the duration. Sessions include engagement at schools, communities or businesses.
- Female participation figures represent the percentage of active employees as at 30 June 2025. Excludes Labour Hire, Directors, Owner Drivers, Contractors and Consultants. Determined based on headcount.
- SIFR colculation includes employees, non-permanent labour, contractors, large contractors, owner drivers and hours associated with employee leave. For more information please visit ESG data book
Recognition
Awards and recognition

Discover