


About
Committed to a sustainable future
We are continuing to make progress against our four sustainability pillars and our role in supporting Australia's transition to a circular economy. Explore our performance, key initiatives and measurable outcomes and our transparent insight into how we manage environmental, social and governance responsibilities.


Our promise
Our sustainability pillars
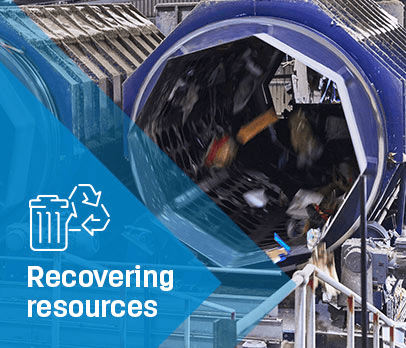
Recovering resources
We play a vital role in enabling Australia’s circular economy, working with our partners to ensure valuable resources are recovered from waste streams and returned to the value chain.
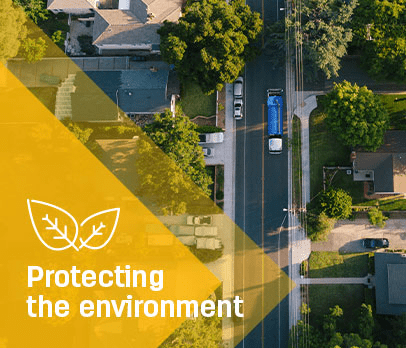
Protecting the environment
As a total waste solutions provider, we prioritise resource reuse, recycling, and recovery wherever possible. When these options are not feasible, we offer safe and responsible, at-scale treatment and disposal solutions.
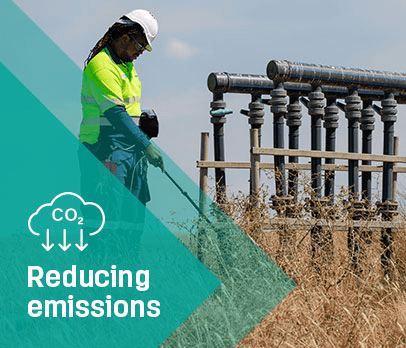
Reducing emissions
The goal of net zero compels us all to take action to reduce the impacts of climate change. Cleanaway is committed to reducing our emissions and helping our customers do the same.
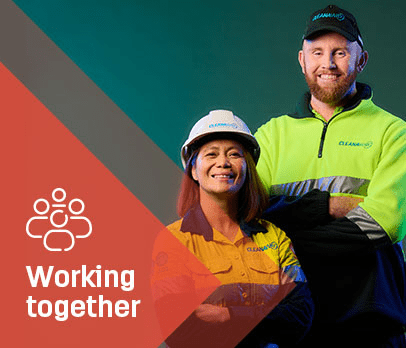
Working together
To deliver on our mission requires the co-ordinated effort and hard work of our people, suppliers and communities. Together, we fulfil our purpose of making a sustainable future possible together.
Recovering resources
TAS facilities
FY25 224kt
through Cleanaway’s central
commodities trading desk
FY25 442kt
through Cleanaway’s central
commodities trading desk
FY25 24kt
to be processed through
Cleanaway facilities
FY25 103ML
1 Includes joint ventures

Protecting the environment
toolkits in place
sites in FY26
assurance
conducted in FY26
compliance
environmental incidents in FY26
Reducing emissions
2 emissions 2
captured
of waste in our landfills
FY25 256.9 Mm3
from landfill gas 1
1 Generated by Cleanaway or third parties. The decrease compared with the prior year reflects a planned reduction in engine gas throughput and unplanned engine downtime between January and April 2026.
2 Gross Scope 1 and 2 greenhouse gas emissions calculated using methods prescribed as Method 1 under the National Greenhouse and Energy Reporting (Measurement) Determination 20028. For more information please visit ESG Databook.
Working together
Frequency Rate (SIFR) 1
Frequency Rate (TRIFR) 2
women in our workforce 3
events 4
1 Serious Injury Frequency Rate (SIFR) calculation includes employees, non-permanent labour, contractors, large contractors, owner drivers and hours associated with employee leave. For more information please see ESG Databook.
2 Total Recordable Injury Frequency Rate (TRIFR) calculation includes employees, non-permanent labour, contractors, large contractors, owner drivers and hours associated with employee leave. For more Information please see ESG Databook.
3 Representation of women in our workforce represents the percentage of active employees as at 30 June 2026. Excludes Labour Hire, Directors, Owner Drivers, Contractors and Consultants. Determined based on headcount.
4 An event is an activity where the number of attendees cannot be quantified. Events Include conference presentations, Information stalls and festivals.

Recognition
Awards and recognition




Discover
Previous reports
Sustainability Reports published prior to 2026 represent voluntary sustainability content and were not prepared as mandatory climate-related financial disclosures under AASB S2.